
CVD를 사용함에 있어 오해하기 쉬운 내용을 다뤄 봅니다.
We’ll cover some common misconceptions about using CVDs.
1/ CVD와 가격흐름에 대한 일반적인 생각
사람들이 착각하는것 중에 하나는 CVD가 하락하면 시장에 매도가 많다는 거니까 가격이 떨어지지 않을까.. 이다.
아래 그림을 보면. 2달전 고점과 가격은 동일한데.. CVD는 하락을 하니까.. 앞으로 가격이 하락 하는게 너무 당연해보인다.
One of the misconceptions people have is that when CVD goes down, there is a lot of selling in the market, so the price will go down.
If you look at the figure below. The price is the same as the high 2 months ago, but the CVD is falling, so it seems very natural that the price will fall in the future.
2/
그런데 조금만 지난.. 과거 데이터를 살펴보면 그렇지 않다는 것을 쉽게 알 수 있다.
초록색 구간도, 파란색 구간도 모두, CVD는 하락하지만 가격은 오르는걸 알 수 있다.
이번이 특수한 케이스라고 생각할 그대를 위해.. 지난 20~21년 불장 때는 어땠는지 한번 봐보자..
But a little past… Looking at the historical data, it’s easy to see that this is not the case.
In both the green and blue bands, you can see that CVDs are going down, but prices are going up.
For those of you who think this is a special case. let’s look at the last 20-21 years of bull markets…

3/
코로나 빔 때, 비트코인 4,000달러부터 ~ 21년 고점, 64,000달러까지 가격이 오르는 동안.. CVD는 줄 곧 하락해 왔음을 확인할 수 있다.
‘펌핑 할 때 고래들이 개미들한테 물량을 떠 넘기니까 그런거지..’ 라고 생각할 그대를 위해.. 좀 더 축소 시켜보겠다.
During the Coronavirus, Bitcoin went from $4,000 to ~21 year highs, $64,000… while CVD went down. you can see that the CVD has been falling for a while now.
For those of you who are thinking, ‘That’s because the whales are pumping out the ants when they pump…’ For those of you who might be thinking. let’s zoom out a bit more.
4/
맞다. CVD 하락은 ‘장기적으로’ 가격과 전혀 상관 관계가 없음을 알 수 있다.
잠깐, 그럼 단기적으로는 어떨까??
일단, 아래 하늘색 동그라미 부분에 약간의 매수세 보이나? 축소시켜 보면 티도 안나는… 그 순매수 양으로 비트코인은 20,000달러에서 28,000달러까지 올랐다.
That’s right. We can see that the drop in CVD is completely uncorrelated to price in the “long run”.
Wait, what about the short term?
Well, see that little bit of buying in the light blue circle below? Zooming out, it’s Tido Anna… That net buying pushed Bitcoin from $20,000 to $28,000.

5/
순매수가 증가하면서 CVD가 상승했고~ 그에 따라 가격도 같이 상승했다. 저 구간은 가격과 상관 관계가 있어보인다.
맞다. CVD는 단기로 봐야한다.
그래서.. 이를 어떻게 생각해야 하냐면.. 단기적으로 상대적인 값만 의미를 가지는 데이터라고 봐야한다.
As net buying increased, the CVD increased ~ and so did the price. That area looks correlated with price.
Right. CVD should be viewed as short-term.
So… how should we think about this? It’s data that only means relative values in the short term.
가령, 오늘 매도 물량이 1000개가 나온게 중요한게 아니라…
어제 매도물량이 5000개 였는데 오늘 매도 물량이 1000개가 나왔는지..
어제 매수 물량이 5000개 였는데 오늘 매도 물량이 1000개 나왔는지..
그 상대적인 값, 추세속에 그 데이터가 의미를 갖는다는 것이다.
For example, it doesn’t matter if there were 1000 sells today…
If there were 5000 sellers yesterday and 1000 sellers today…
It’s whether there were 5000 buyers yesterday and 1000 sellers today.
It’s the relative value, the trend, that makes that data meaningful.
6/
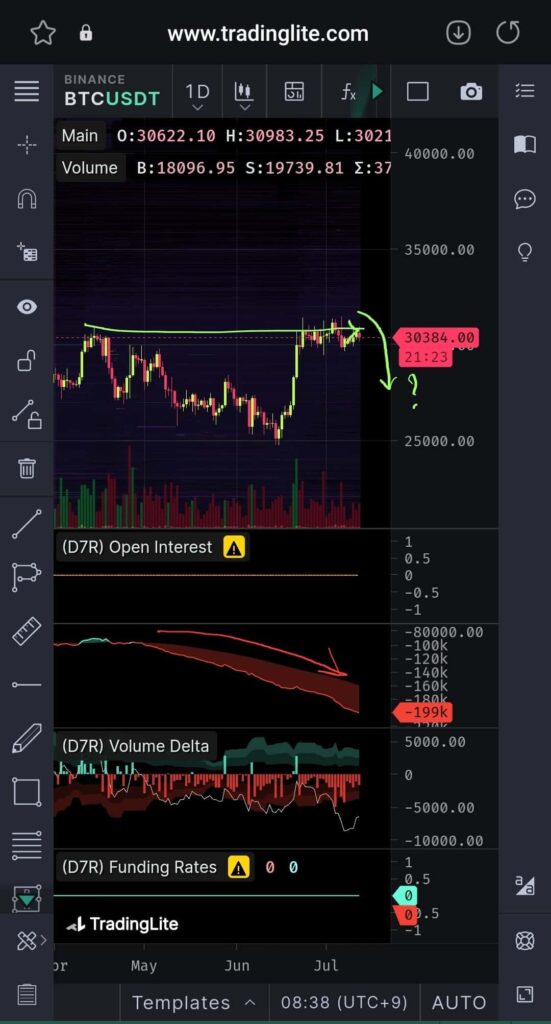
그래서 아래 사진과 같이 CVD가 내려가는건 기본값, 그냥 당연한 것이고,
Volume Delta 값이 전날보다 오르는 구간이 가격 상승과 연관되어 있다.라는 것이다.
Volume Delta 변화값이 크면 클수록 아웃풋인 가격 변화도 크고 말이다.
So when the CVD goes down, like in the picture below, it’s the default, it’s just natural,
Volume Delta values that are higher than the previous day are associated with higher prices.
The larger the change in Volume Delta, the larger the output price change.
7/
그래서 이 가설을 최대한 유리하게 적용하려면.. 순매도량, Volume Delta 값이 아래로 크게 찍히면 찍힐수록 그 지점은 매수에 적합한 구간이 된다.
왜냐하면 크게 찍히면 찍힐수록 그 이후에 Volume Delta는 상대적으로 올라갈 가능성이 높으니까 말이다.
So to apply this hypothesis to our advantage… the bigger the dip in the net short interest, the bigger the dip in the Volume Delta, the more likely it is that that point is a good place to buy.
Because the bigger the dip, the more likely it is that the Volume Delta will be relatively higher afterward.
그래서 Volume Delta 값이 낮을 때 샀다가, 양수로 전환 되거나 혹은 어느 기준 값 이상이 되었을 때 파는, 하나의 전략이 나올 수 있다.
대규모 매수/매도는 몇일 연속으로 나올 가능성 거의 없고, 그 규모도 점점 작아지는 특성이 있으니까 말이다.
Therefore, one strategy might be to buy when the volume delta is low and sell when it turns positive or above some threshold.
This is because large buy/sell events are unlikely to occur for several days in a row, and tend to be smaller and smaller in size.

8/
마지막으로 당부드릴건, 이 이론을 단순 공식 대입하듯 당장 적용시키면 안되고, 이해를 통해 적용 시켜야 한다. 1+1은 알지만, 사과 1개 더하기 1개는 모르는 상태를 경계해야 한다.
그리고, 이 이론은 100% 만능 치트키가 아니니 직접 테스트해보면서 적용하시길 바란다.
Finally, it’s important to remember that this theory shouldn’t be applied immediately, like a simple formula, but through understanding. Be careful not to get caught in the trap of knowing 1+1, but not knowing 1 apple plus 1 apple.
Also, this theory is not a 100% one-size-fits-all cheat, so please test and apply it yourself.
9/
그리고 20,000달러에서 28,000달러까지 펌핑 때의 순 매수량은 2020년도 말 때의 순 매수량 보다 더 크다.
And the net buying volume when pumping from $20,000 to $28,000 is greater than the net buying volume at the end of 2020.

+ 트레이딩 라이트 설정법은 다음 글을 참고 해주세요.


선생님 양질의 글 잘 보고 있습니다.
혹시 여유가 되신다면, 블로그에 쓰셨던 온체인 데이터 지표들 (AC, MVRV 등..)과 TRADING LITE의 지표들 (CVD, 펀딩피, OI)에 대한 의견을 최신판으로 알려주실수 있을까요?
항상 감사드립니다. 오늘도 좋은 하루 되세요 ^^
오키ㅎ 관련하여 글 써보겠습니다^^